Benchmarking nodejs streams
I was trying to compare my new streamable haml parser against other implementations and my results kept getting inconsistent. What I didn’t realised at first was that I was trying to compare things that can’t be compared.
The first point is obvious: the golden rule of a useful benchmark is to only compare apples and apples.
From redis documentation
# What is benchmarking?
First, I should’ve asked myself “What is benchmarking?”. The answer might be obvious, but asking questions is never stupid.
Benchmark, the result of running a computer program to assess performance
That I knew already, but this leads to a better question: “What can be benchmarked when talking about streams?”
With a few google searches, I ended up on this issue where some guys are computing the “speed” of a stream (in bytes/s). It seems an interesting approach to stream benchmarking and we can call it an I/O benchmark. In fact, if we talk about transform streams, this will be the only consistent thing to base comparisons on.
But what about operations per seconds or memory consumption? Those are also things that would be interesting to measure. Especially if we want to blindly compare performances between two softwares, that are doing the same task, but not the same way!
# Input/Output measure
Let’s start with what seems to be the stream unit of measure, which are bytes per seconds. My stream is a Transform stream which:
- Reads HAML input (
.write()is called, or aReadableis piped to it) - Streams HTML output (
.read()will get this output to the nextWritablepipe)
And what I want to know is “How long does it take to transform the data (input) to the data (output)”. To do so, we first need a reference to compare with. We can have the same input that goes to a Transform stream which does nothing else then outputting the data.
And there is the reference code:
'use strict'
const Stream = require('stream')
const fs = require('fs')

let start = null
let bytes = 0

let transform = new Stream.Transform({
  transform: function(chunk, enc, next) {
    if(start === null)
      start = process.hrtime()

    bytes += chunk.length

    process.nextTick(() => next())
    next()
  },
  flush: function(done) {
    done()
  }
})

transform.on('finish', function() {
  let diff = process.hrtime(start)
  diff = diff[0] * 1e9 + diff[1]

  console.log('%d bytes processed', bytes)
  console.log('%d bytes per sec', bytes / diff * 1e9)
})

fs.createReadStream(`${__dirname}/page.haml`)
.pipe(transform)
Outputs:
606 bytes processed
343070.0695141482 bytes per sec
Now let’s apply this exact same script but call the _transform and _flush methods of the stream we want to benchmark:
'use strict'
const Stream = require('stream')
const fs = require('fs')
const Jhaml = require('@soyuka/jhaml')

let start = null
let bytes = 0

let jhaml = new Jhaml()

let transform = new Stream.Transform({
  transform: function(chunk, enc, next) {
    if(start === null)
      start = process.hrtime()

    bytes += chunk.length

    jhaml._transform(chunk, enc, next)
  },
  flush: function(done) {
    jhaml._flush(done)
  }
})

transform.on('finish', function() {
  let diff = process.hrtime(start)
  diff = diff[0] * 1e9 + diff[1]

  console.log('%d bytes processed', bytes)
  console.log('%d bytes per sec', bytes / diff * 1e9)
})

fs.createReadStream(`${__dirname}/page.haml`)
.pipe(transform)
Outputs:
606 bytes processed
57742.39251125 bytes per sec
Ok this is great, and we can get data out of it. But who means statistics, means lot of data. Running it once will give us an idea, but getting an average of multiple runs will be more precise.
To do so, we’re putting these together with Benchmark.js. Note that both previous scripts are transformed to modules which are instantiating a new stream. If we don’t do this we’ll get the well known Error: write after end error.
'use strict'
const Benchmark = require('benchmark')
const fs = require('fs')
const suite = new Benchmark.Suite
const reference = require('./reference.js')
const jhaml = require('./jhaml.js')
const jhamltojavascript = require('./jhaml.javascript.js')
const jhamltohtml = require('./jhaml.html.js')

//array that will be used to store speeds and compute an average
var avg = []
var bytes = []
var num = 0

function bench(transform, deferred) {
  transform.on('bytes', function(b) {
    bytes.push(b)
    num++
  })
  transform.on('speed', function(speed) {
    avg.push(speed)
    deferred.resolve()
  })

  fs.createReadStream(`${__dirname}/page.small.haml`)
  .pipe(transform)
}

suite
.add('reference', function(deferred) {
  bench(reference(), deferred)
}, {defer: true})
.add('jhamltojavascript', function(deferred) {
  bench(jhamltojavascript(), deferred)
}, {defer: true})
.add('jhamltohtml', function(deferred) {
  bench(jhamltohtml(), deferred)
}, {defer: true})
.add('jhaml', function(deferred) {
  bench(jhaml(), deferred)
}, {defer: true})
.on('cycle', function(event) {
  console.log(String(event.target))
  let l = avg.length
  avg = avg.reduce((p, n) => p += n)
  avg /= l
  console.log(
    'Average speed %d Megabytes/s',
    (avg / 1e6).toFixed(2)
  )
  avg = []
  console.log(
    'Cycle read %d Megabytes in %d runs',
    (bytes.reduce((p, n) => p += n) / 1e6).toFixed(2), num
  )
  bytes = []
  num = 0
})
.on('complete', function() {
  console.log('Fastest is ' + this.filter('fastest').map('name'));
  console.log('Slowest is ' + this.filter('slowest').map('name'));
})
.run({async: true})
Running this gives the following output (page.haml is ~80Kb):
reference x 9,233 ops/sec ±3.53% (69 runs sampled)
Average speed 68.71 Megabytes/s
Cycle read 64.17 Megabytes in 44685 runs
jhamltojavascript x 459 ops/sec ±1.64% (79 runs sampled)
Average speed 0.73 Megabytes/s
Cycle read 3.09 Megabytes in 2149 runs
jhamltohtml x 444 ops/sec ±2.47% (81 runs sampled)
Average speed 0.69 Megabytes/s
Cycle read 3.03 Megabytes in 2110 runs
jhaml x 480 ops/sec ±1.72% (84 runs sampled)
Average speed 0.75 Megabytes/s
Cycle read 3.19 Megabytes in 2221 runs
Fastest is reference
Slowest is jhamltohtml, jhamltojavascript
So, comparing apples with apples, it’s obviously way slower then doing nothing.
What’s interesting is that the slowest is jhamltohtml (based on operations per seconds). Knowing that it’s not running any javascript this seems weird. I think that it’s due to the fact that it pushes content more often (.push(chunk)).
To be sure, let’s try keeping the HTML string in memory and only do .push(chunk) once:
reference x 9,443 ops/sec ±2.81% (68 runs sampled)
Average speed 71.84 Megabytes/s
Cycle read 66.18 Megabytes in 46085 runs
jhamltojavascript x 467 ops/sec ±1.89% (80 runs sampled)
Average speed 0.75 Megabytes/s
Cycle read 3.16 Megabytes in 2202 runs
jhamltohtml x 493 ops/sec ±1.74% (79 runs sampled)
Average speed 0.78 Megabytes/s
Cycle read 3.27 Megabytes in 2275 runs
jhaml x 477 ops/sec ±1.71% (81 runs sampled)
Average speed 0.76 Megabytes/s
Cycle read 3.19 Megabytes in 2222 runs
Fastest is reference
Slowest is jhamltojavascript,jhaml
Yup, this is it. Nevermind, we better push the content as it comes but this is good to know!
The thing is, every script does not run the same amount of times. This means that when computing the average speed, the amount of data collected is not the same. Comparison could therefore be made on false assumption, from a scientific point of view. So, let’s try something else.
# Memory consumption, process usage and speed
Now, I want to see how much memory this uses. Because pidusage also gets the process usage (like ps), I’ll also try to use it for comparison.
I don’t think that process usage will change a lot because this is mostly the same algorithm, only the javascript execution differs. On the other hand, I expect the memory of jhaml and jhamltojavascript to be higher. Indeed, it keeps the whole javascript string in memory.
What we need for this is:
- fork a process doing some job
- measure process and memory usage
- compare data
Comparing data is a lot more fun when they are all running together, let’s do this.
I used relieve QueueWorker to handle the forks.
That’s the basic idea (full code here):
// worker
'use strict'
const relieve = require('relieve')
const CallableTask = relieve.tasks.CallableTask
const QueueWorker = relieve.workers.QueueWorker
const worker = new QueueWorker({concurrency: 1})

const RUNS = 100
const MONIT_INTERVAL = 1

let scripts = ['jhaml.html', 'jhaml.javascript', 'jhaml', 'reference']
let paths = scripts.map(e => `${__dirname}/../${e}.js`)

for(let i in paths) {

  let x = RUNS

  while(x--) {
    let task = new CallableTask(`${__dirname}/task.js`)

    task.arguments = [paths[i]]
    task.name = scripts[i] + '-' + (x+1)

    task.once('start', function() {
      //start monitoring
      task.call('run')
    })

    task.once('exit', function() {
    })

    task.once('bytes', function(b) {
    })

    task.once('speed', function(speed) {
    })

    worker.add(task)
  }
}

worker.run()
.then(function() {
  for(let i in scripts) {
    //compute data and print result
  }
})

worker.on('error', function(err) {
 console.error(err);
})
And the task:
//task
'use strict'
const p = require('path')
const fs = require('fs')
var channel

let path = process.argv[3]
let name = p.basename(path)

let transform = require(path)()

module.exports = {
  setChannel: c => channel = c,
  run: () => {
    fs.createReadStream(`${__dirname}/../page.haml`)
    .pipe(transform)

    transform.on('bytes', (b) => {
      channel.send('bytes', b)
    })

    transform.on('speed', (speed) => {
      channel.send('speed', speed)
      process.exit(0)
    })
  }
}
Now, the full code is a bit more dense because after adding process and memory usage, I added a progress bar which gave me the idea of adding the speed and bytes readen to the results. Actually, it is a good thing and now I have:
- pretty results
- I know exactly what my benchmark does in comparison to
benchmark.js. For example it runs 100 times and not an approximate number of runs that I can’t control. - results seems more accurate for a comparison
- every run uses a child process which is not impacted by the benchmark code (memory usage, process computation are independent)
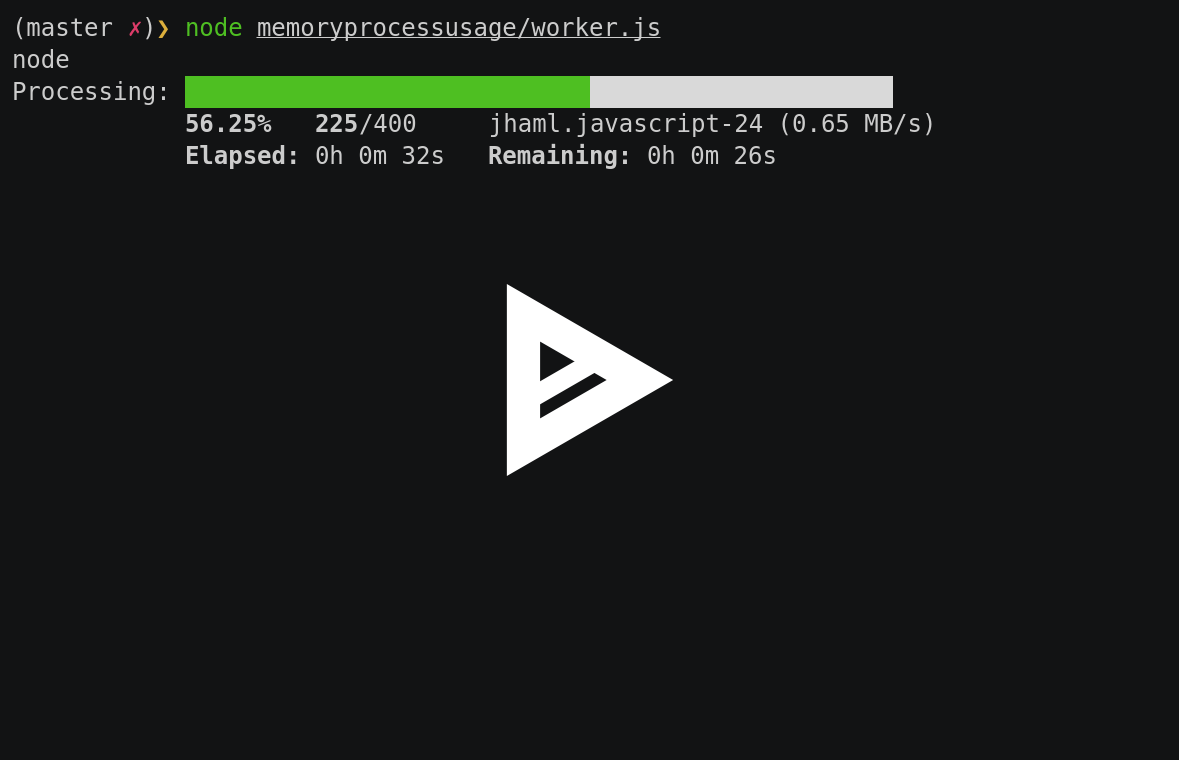
Check out the asciinema (with 100 runs):
Resulting in (with 400 runs):
jhaml.html (400 runs):
  took an average of 26.65 MB memory usage
  process usage was about 22.29 %
  average speed: 0.61 MB/s
  bytes readen: 32.02 MB
jhaml.javascript (400 runs):
  took an average of 26.46 MB memory usage
  process usage was about 20.72 %
  average speed: 0.66 MB/s
  bytes readen: 32.02 MB
jhaml (400 runs):
  took an average of 27.39 MB memory usage
  process usage was about 23.28 %
  average speed: 0.57 MB/s
  bytes readen: 32.02 MB
reference (400 runs):
  took an average of 11.9 MB memory usage
  process usage was about 3 %
  average speed: 38.33 MB/s
  bytes readen: 32.02 MB
The process and memory usage are slightly more important when computing javascript, which is no surprise. Interesting thing to notice is that the more .push you do the more cpu intensive the transformable stream gets. Here, jhaml.javascript (which just keeps a javascript string in memory) took 20,72% against 22.29% when just sending chunks whenever they come.
I’m glad to see that all this heavy parsing process only takes about twice as much memory as in the reference! My previsions were not entirely right though. jhaml memory usage is greater then the others but jhaml.haml and jhaml.javascript have about the same memory consumption.
Average speed looks like crap when compared to the reference. However, it’s nice that jhaml does run slower than everything else, which is not what benchmark.js told us before. It is what I expect it to be in terms of “speed” (here Megabytes/s).
# Conclusion
When it comes to benchmarking, just running some script and trying to get hasty conclusions is not enough. You have to make sure that:
- you compare apples with apples
- you know what you want to benchmark (define “speed” - is it memory usage, operations per seconds, Megabytes per seconds etc.?)
- the numbers you’re looking at are reflecting reality
- you’re in control of the numbers, not the other way around
For example, benchmark.js didn’t run the same number of rounds on each benchmark. This lead to an average speed calculation that would not be precise enough for comparison. With my second attempt, the speed is calculated on the same amount of data, which gives a much more interesting point of comparison.
Now to compare this to non-streamable haml parser I hit a wall. I can’t really compare the number of operations per seconds because numbers don’t feel right. I could compare process and memory usage but it will not be reflecting improvements on the “speed” side. What can be compared though is page rendering with an http server. In this case, “speed” would be the human feeling you have when waiting for the page to show. Note that both of the other parser’s have a caching ability. So, to do this I’d have to move the javascript engine to another transformable script (input javascript, output html) so that it could be re-used. Then, the javascript could be cached and executed-only.
Still, what about non-interpretable haml (read static page)? Even if I wanted to compare the request “speed” between parsers, my advantage is that I can stream the content to the response. On the other hand, other parsers will have to compute, then send the result (even without code interpretation), and maybe block the script while they’re at it.
In an asynchronous world, what would you do best?